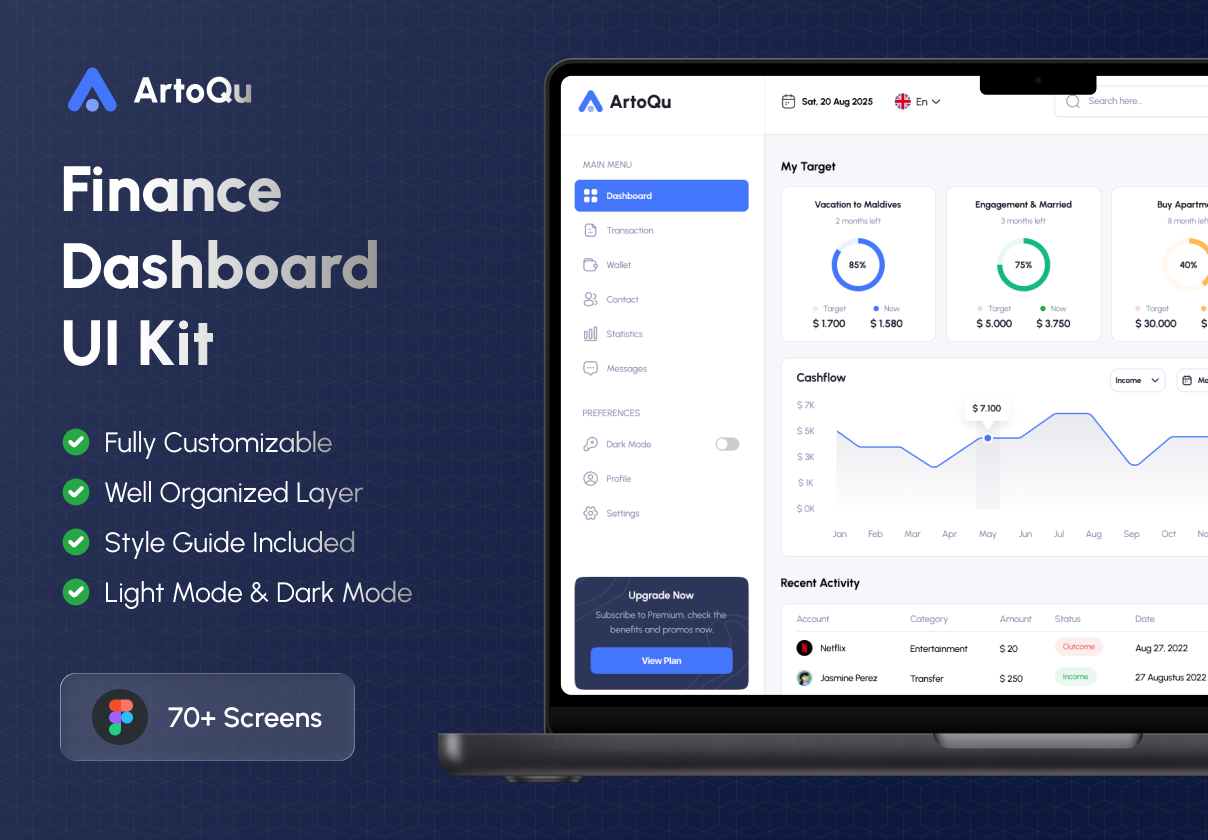


📊 ArtoQu – Finance Dashboard UI Kit (70+ Screens)
🌐 Overview
A comprehensive Finance Dashboard UI Kit designed for web applications and SaaS platforms in the financial sector. With 70+ meticulously crafted screens, this kit empowers designers and developers to build data-rich, visually engaging dashboards that track, analyze, and forecast financial performance.
Built with customization and flexibility in mind, it offers dark and light modes, organized layers, and a robust style guide for seamless scalability.
✨ Key Features
70+ Screens covering dashboards, reports, transactions, settings, and more
Fully customizable with organized layers for efficient editing
Style guide included for consistent design elements
Light mode & dark mode options for user preference
Interactive charts, progress bars, and financial metrics
📂 Screen Highlights
Main Dashboard
“My Target” cards measuring savings and repayments
“CashFlow” line graph with income vs. spending
“Recent Activity” table showing categorized transactions
Sidebar: Dashboard, Transaction, Contact, Wallet, etc.
Transaction Reports
Detailed breakdown of income sources and expenses
Date range filters for custom reporting
Visual pie charts and bar graphs for easy analysis
Statistics Overview
“Financial Goals” progress with percentage circles
Monthly income trends and spending patterns
Category insights for better financial management

Read the author's instructions below to know how you can get help.
Contact email: N/A
Phone number: N/A
This item has no comments
Sign In to comment
Subscribe to access unlimited downloads of graphics and more premium assets for your creative needs.
Member since Sep 2025
Published:
Sep 22, 2025 12:25 PM
Category: